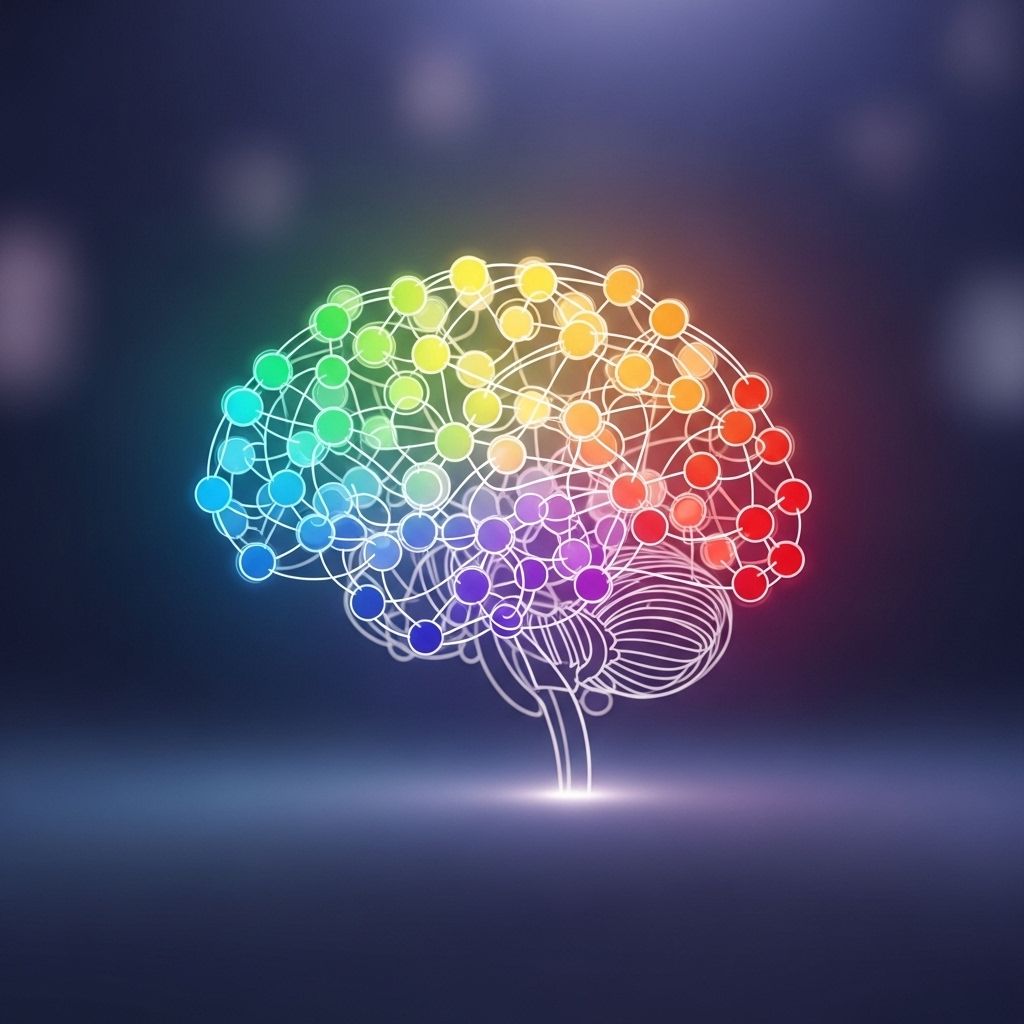
Visualizing Mood Data: Unlocking Insights into Emotional Well-being
Simple charts of daily feelings can reveal patterns and support more mindful self-care.

Table of Contents
- Introduction
- Benefits of Visualizing Mood Data
- Techniques for Visualizing Mood Data
- Tools for Mood Tracking
- Frequently Asked Questions (FAQs)
- Conclusion
Introduction
Emotions are a fundamental part of the human experience, influencing our thoughts, behaviors, and interactions with others. However, the complex and often intangible nature of emotions can make them challenging to understand and manage. One innovative approach to better grasp and navigate emotional landscapes is through the practice of visualizing mood data. This method involves collecting and depicting emotional states over time using various visual tools and techniques, such as graphs, charts, and artistic representations.
By transforming emotional experiences into visual narratives, individuals can gain deeper insights into their emotional patterns and fluctuations. This process not only enhances self-awareness but also facilitates more effective emotional regulation and management. In this article, we will delve into the benefits, techniques, and tools associated with visualizing mood data, exploring how this practice can contribute to improved emotional well-being.
Benefits of Visualizing Mood Data
The benefits of visualizing mood data are multifaceted and profound, offering numerous advantages that can positively impact one’s emotional life. Some of the key benefits include:
- Enhanced Self-Awareness: By visually tracking emotions over time, individuals can become more attuned to their emotional states, recognizing patterns and triggers that might otherwise remain unnoticed.
- Improved Emotional Regulation: Understanding emotional patterns allows individuals to anticipate and prepare for periods of heightened emotional intensity, enabling better emotional management.
- Facilitated Communication: Visual representations of mood data can serve as a valuable tool for communicating emotional states to healthcare providers or loved ones, potentially leading to more targeted support and treatment.
- Emotional Engagement and Retention: The use of color, shape, and spatial arrangements in data visualization can enhance memory retention and emotional engagement, making it easier to recall specific emotional experiences and their associated triggers.
Techniques for Visualizing Mood Data
There are various creative and analytical techniques for visualizing mood data, each offering unique insights into emotional patterns and dynamics. Some of these techniques include:
- Graphic Representations: Using shapes, colors, and patterns to represent different emotions. For example, assigning positive moods to pleasant flavors or colors and negative moods to less appealing ones.
- Thematic Visualizations: Creating themed visualizations, such as using Halloween candies to depict fear, worry, and anxiety, can make the exploration of complex emotions more engaging and less intimidating.
- Time-Based Charts: Utilizing line charts or bar graphs to track mood fluctuations over time, providing a clear visual of emotional trends and changes.
Tools for Mood Tracking
A variety of digital and analog tools are available for mood tracking, ranging from dedicated apps to personal journals. Some popular digital tools include:
- MoodFit and Worry Watch: Apps designed to help users track and manage their mood, providing insights into emotional patterns and triggers.
- Open-Ended Journal Entries: Using diaries or journals to record emotions either through written descriptions or by using visual symbols like emojis.
- Data Entry and Review Screens: Many apps offer structured data entry methods, such as sliders or text fields, and review screens that display mood data in feeds, charts, or summaries.
Frequently Asked Questions (FAQs)
Q: Why is visualizing mood data beneficial?
A: Visualizing mood data helps improve self-awareness, promotes better emotional regulation, and facilitates more effective communication with healthcare providers. It also enhances emotional engagement and retention.
Q: What tools are available for mood tracking?
A: Tools range from dedicated mood-tracking apps like MoodFit and Worry Watch to personal journals and creative visualizations using art or symbols.
Q: How does storytelling in data visualization enhance emotional engagement?
A: Storytelling in data visualization adds an emotional layer to the data, making it more relatable and memorable. This narrative can drive action and retain viewer attention more effectively than raw data alone.
Conclusion
Visualizing mood data offers a powerful tool for enhancing emotional understanding and well-being. By leveraging creative and analytical techniques to represent emotional states, individuals can gain deeper insights into their emotional landscapes, leading to improved self-awareness and more effective emotional management. This practice, combined with the use of digital tools and storytelling, can empower individuals to navigate their emotions more effectively and foster a healthier emotional life.
References
- https://nightingaledvs.com/data-mood-journals/
- https://pmc.ncbi.nlm.nih.gov/articles/PMC8387890/
- https://data-pilot.com/blog/why-we-love-diagrams-the-psychology-behind-data-visualization/
- https://positivepsychology.com/mood-charts-track-your-mood/
- https://www.alisbh.com/blog/mood-tracking-tools-and-benefits/
- https://immerse.news/what-role-does-emotion-play-in-data-visualization-bf365edf3d53
Read full bio of Sneha Tete


