How Our Transportation Choices Shape Urban Development and Carbon Footprints
The ways we move influence cityscapes, emissions, and our pathway to a low-carbon future.

How We Move Shapes Our Cities and Our Emissions
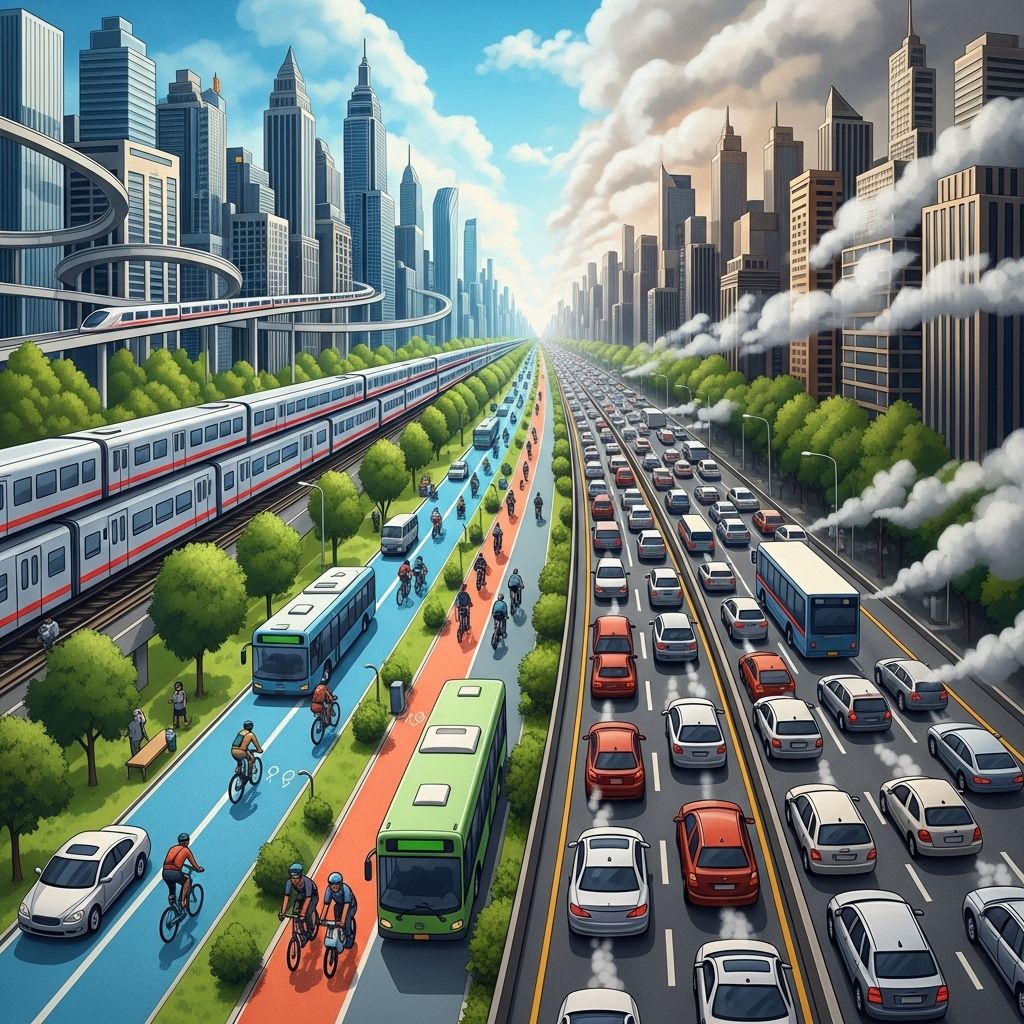
The choices we make about how we get around—cars, public transit, biking, walking, and flying—not only determine our daily routines but also profoundly shape our cities and our carbon footprints. These transportation patterns influence urban design, infrastructure investments, energy use, and the future sustainability of communities.
Transportation: The Key Driver of Urban Form
Cities and towns are physically molded by the dominant modes of transportation available. In places where cars are the primary means of mobility, development sprawls outward, requiring extensive roads, parking lots, and vast networks of infrastructure. In contrast, cities focused on public transit, walking, and bicycling concentrate housing, offices, and retail around transit hubs or walkable streets, making them denser and more energy-efficient.
- Car-centric cities tend to sprawl, resulting in greater distances between homes and workplaces, higher infrastructure costs, and increased land consumption.
- Transit-oriented development clusters buildings and amenities around public transport routes, shrinking the carbon footprint per person.
- Biking and walking infrastructure encourages healthier urban forms, lower emissions, and better air quality.
Ultimately, the way a community is designed reflects its transportation priorities—and those priorities are often a matter of historical choices, policies, and investments.
The Carbon Footprint of Automobiles
In most North American cities and suburbs, the personal automobile reigns supreme. This dominance brings significant costs to individuals, communities, and the planet.
- Automobile emissions from millions of cars make transportation the largest source of greenhouse gas emissions in the United States.
- Expanding road networks and parking lots intensify energy use for construction and maintenance, increase impervious surfaces, and harm urban ecosystems.
- The material and energy required to manufacture vehicles and roads adds further u0022embodied carbonu0022 to the overall climate impact.
| Mode | Average Carbon Footprint per Mile (CO2e lbs) | Added Impacts |
|---|---|---|
| Personal Car (Gasoline) | ~1 lb | Road building, parking lots, manufacturing |
| Personal Car (Electric) | Depends on grid | Battery production, electricity source |
| Public Transit (Bus/Train) | Significantly less per passenger | Efficient land use, shared energy costs |
| Bicycling/Walking | Negligible | Infrastructure less carbon intensive |
| Flying | ~53 lbs per mile (plane, per person) | Massive upfront energy/carbon/material costs |
Flying: The High-Carbon Outlier
Air travel is one of the most carbon-intensive ways to move people—and its share of global emissions is growing rapidly.
- A single round-trip flight between New York and San Francisco generates 2–3 tons of CO2 per passenger.
- While flying accounts for a smaller share of trips compared to driving, it can represent a major percentage of an individual’s annual carbon output.
- The materials and energy required to build aircraft—including aluminum, carbon fiber, and plastics—add “embodied carbon” upfront.
- Retired planes are frequently landfilled or end up in “airplane boneyards,” compounding environmental costs.
Private aviation is even more damaging, using many times more energy per passenger.
Infrastructure: The Hidden Carbon Cost
Transportation modes require vast amounts of infrastructure—everything from roads and bridges to airports and rail stations. This built environment has a massive, often underappreciated, carbon footprint due to the manufacturing of materials and the energy spent during construction.
- Road construction emits significant greenhouse gases through the production and laying of asphalt and concrete.
- Parking lots not only require energy and materials but also encourage more driving and sprawl, increasing emissions further.
- Rail and transit infrastructure involves considerable upfront carbon, yet results in lower per-person emissions over time thanks to higher efficiency.
- Aircraft manufacturing has a huge carbon and resource footprint, with limited end-of-life reuse.
The balance between upfront infrastructure emissions and long-term operational savings is most favorable when cities promote denser, transit-oriented development.
Comparing Transportation Modes: Carbon Footprint and Efficiency
| Mode | Upfront (Embodied) Carbon | Operational Emissions | Typical Urban Form |
|---|---|---|---|
| Car | High (vehicle, roads) | High (fossil fuel) | Sprawl, suburban |
| Public Transit | Medium (rails, stations) | Low per rider | Dense, transit-centered |
| Biking/Walking | Very low (sidewalks, bike paths) | Negligible | Compact, mixed-use |
| Flying | Very high (planes, airports) | Very high, per mile | N/A (long-distance) |
Impacts Beyond Carbon: Wildlife, Pollution, and Equity
Transportation doesn’t just influence emissions—it affects wildlife, air quality, public health, and socioeconomic equity.
- Roads fragment habitats and lead to thousands of wildlife-vehicle collisions yearly.
- Air pollution from cars and aircraft is a leading cause of respiratory illness, especially in lower-income communities near busy corridors.
- Dedicating urban space to cars increases inequality, excluding non-drivers and reducing housing affordability.
- Dense, multimodal cities enable access for all, regardless of income, age, or ability.
Towards Sustainable Mobility: Reducing Your Transportation Footprint
A climate-resilient future depends on rethinking transportation at every level—from individual choices to citywide policy. Several strategies enable individuals and communities to shrink their transportation-related emissions.
- Switch from driving to public transit, biking, and walking whenever possible.
- Opt for electric vehicles powered by renewable energy to minimize emissions from personal travel.
- Avoid unnecessary flights, especially for short or medium distances where rail or bus may be viable alternatives.
- Support policies for complete streets, bike lanes, and reliable transit that encourage sustainable travel for all.
- Choose housing close to work, transit, or schools to reduce travel distances.
- Promote urban forms that concentrate development around transit hubs and reduce the need for driving.
- Advocate for zero-emission infrastructure and climate-focused urban planning.
Lessons from Around the World: Rethinking What We Build
Many leading cities have demonstrated that building for people, not cars, yields immense benefits:
- Paris invested heavily in bike lanes, pedestrian paths, and reduced car traffic, transforming the cityscape and slashing emissions.
- New York City increased pedestrian spaces in Times Square and invested in transit, reducing congestion and promoting sustainable mobility.
- Copenhagen prioritized bicycles and integrated public transit, making nearly half of commutes car-free。
As more cities adopt visionary transport strategies, they achieve cleaner air, lower emissions, greater livability, and climate resilience。
The Future: Innovating for Low-Carbon Mobility
Emerging technologies and creative solutions are reshaping transportation:
- Electric car adoption, supported by cleaner electricity grids, offers the potential for nearly zero-carbon travel, especially as battery technology and manufacturing become greener。
- Solar panels for buildings and charging infrastructure increase access to renewable energy for mobility。
- Lightweight, biodegradable materials and repeated design innovation promise greener vehicles and infrastructure。
- Smarter supply chains—prioritizing local materials and efficient transport—shrink the carbon footprint of everything we build。
While some exotic solutions, like Hyperloop, capture headlines, proven technologies (buses, trains, bikes) consistently deliver better carbon and land use outcomes。
Frequently Asked Questions (FAQs)
Q: Which transportation mode has the highest carbon footprint per mile?
A: Airplane travel has the highest carbon footprint per mile per passenger, producing up to 53 pounds of CO2 per mile. Private jets are even more carbon-intensive due to low occupancy。
Q: How can I reduce my transportation carbon footprint?
A: Use public transit, bike, or walk whenever possible。 For unavoidable car travel, opt for electric vehicles powered by renewable energy。 Minimize air travel, especially short trips, and support climate-friendly urban planning。
Q: Does switching to electric vehicles always lower emissions?
A: Electric cars can greatly reduce emissions if charged with renewable electricity, though manufacturing batteries does generate some upfront carbon。 Benefits increase as grids become cleaner。
Q: Why does urban design matter for sustainability?
A: Urban form determines whether most trips are made by car or by transit, bike, or walking。 Compact, mixed-use development supports low-carbon mobility and reduces infrastructure needs。
Q: Are there other impacts of transportation choices beyond carbon?
A: Yes—transport modes influence air pollution, wildlife collisions, public health, housing affordability, and social equity。
Conclusion: Building a Climate-Forward Future
Transportation is both a personal choice and a collective challenge。 How we move shapes our built environments, our climate impact, and the well-being of communities。 By making conscious decisions about mobility and advocating for climate-smart urban planning, we can turn our cities into engines of sustainability—one step, bike ride, bus trip, or train journey at a time。
References
- https://www.bmptreehugger.com/about-us/sustainability/
- https://ecooptimism.com/?tag=treehugger
- https://climatesteps.org/climate-steps/transportation/
- https://www.c2es.org/content/reducing-your-transportation-footprint/
- https://science.howstuffworks.com/environmental/green-science/carbon-offset.htm
- https://sustainabletravel.org/issues/carbon-footprint-tourism/
Read full bio of Sneha Tete


