Striking Examples of Deforestation Revealed by NASA’s Eye in the Sky
Satellite imagery exposes the scale and causes of global deforestation—revealing urgent environmental threats and the need for action.

Striking Examples of Deforestation Exposed by NASA
NASA’s wealth of satellite imagery provides an unparalleled global perspective of Earth’s rapidly disappearing forests. Deforestation—defined as the large-scale removal of forest cover for agriculture, logging, or development—has accelerated dramatically in the past 50 years, creating an urgent environmental crisis. By documenting changes through high-resolution, repeat imagery, NASA has illuminated where forests are falling furthest and why this matters for people and planet alike.
The Global Picture: Forest Loss from Space
Deforestation impacts nearly every continent, but some regions have emerged as epicenters of forest loss. According to NASA and supporting earth observation programs, key hotspots include the Amazon Basin in South America, Central Africa, and Southeast Asia. Since the 1970s, the Landsat satellite series has made it possible to systematically track even subtle changes in forest cover, with later missions such as Terra and Aqua, equipped with MODIS sensors, providing daily snapshots of vast swaths of land.
The results are stark: in the last two decades alone, humanity has cleared hundreds of millions of acres of forests, with severe impacts on biodiversity, climate, and local communities.
- Amazon Basin: The largest and most iconic rainforest, now losing forest so quickly that it sometimes emits more carbon than it absorbs.
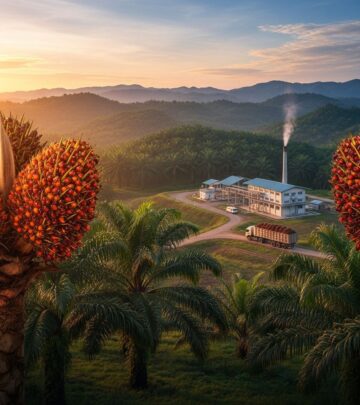
- Southeast Asia: Borneo’s coastal lowlands display rampant clearing for palm oil plantations and logging.
- Central Africa: Congo Basin forests, critical for regional climate stability, are rapidly shrinking due to agriculture and commercial extraction.
- United States: Significant deforestation in the Pacific Northwest, Southeast, and Alaska, with old-growth forests particularly threatened.
Highlighted Deforestation Hotspots from NASA Imagery
| Region | Primary Causes | Ecological Impact |
|---|---|---|
| Amazon Rainforest | Agriculture (soy, cattle), road building, fire, logging | Carbon emissions, biodiversity loss, climate feedbacks |
| Borneo (Southeast Asia) | Palm oil plantations, logging | Loss of endangered species habitat (orangutans), peatland drainage, regional haze |
| Congo Basin (Central Africa) | Shifting cultivation, logging, charcoal production | Loss of tropical biodiversity, altered rainfall patterns |
| United States (PNW, Southeast, Alaska) | Logging, plantations, wildfires, development | Habitat fragmentation, altered hydrology, loss of carbon sinks |
The Amazon Rainforest: Earth’s Lungs Under Threat
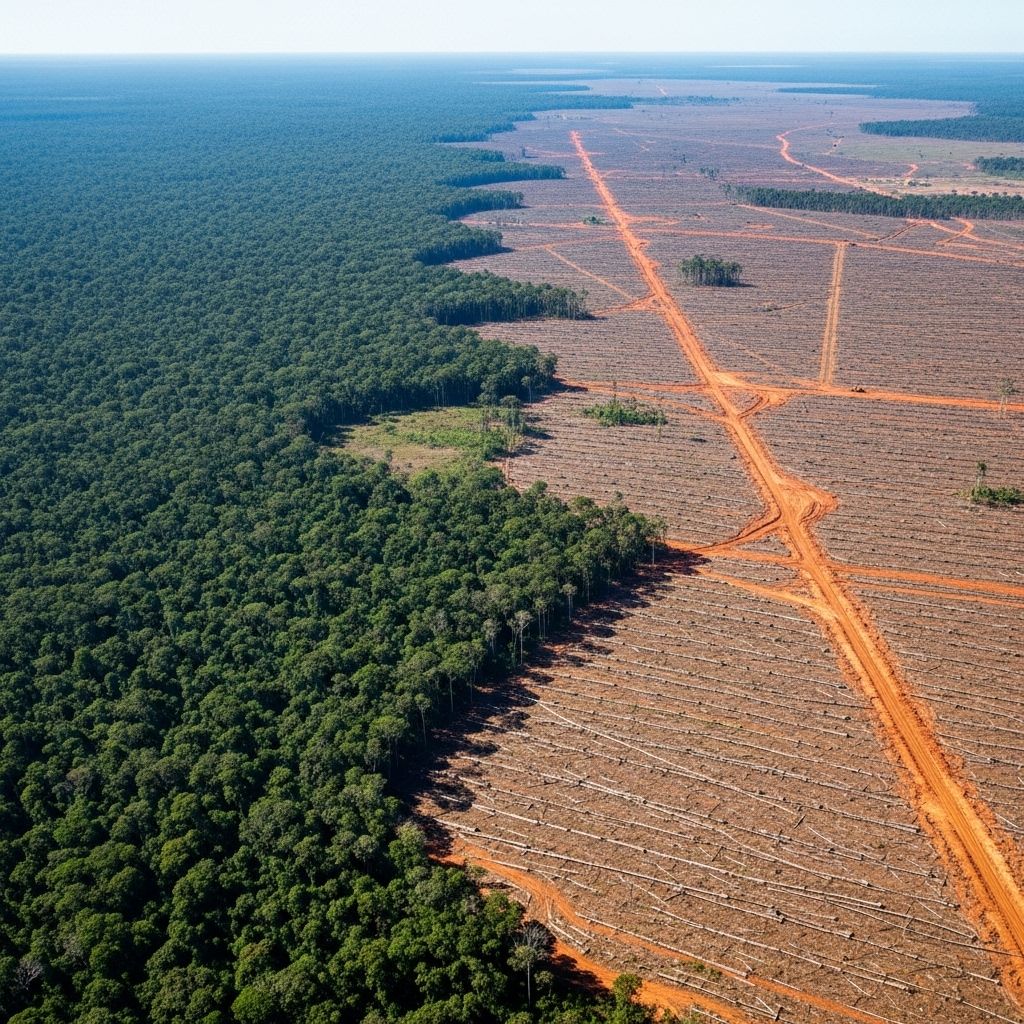
The Amazon is home to more species than any other terrestrial ecosystem and once absorbed much of the planet’s carbon dioxide. NASA’s long-term Landsat imagery has revealed sustained and accelerating losses, especially in Brazil’s state of Mato Grosso, where property boundaries and cleared fields form visible patterns—a checkerboard seen from space.
Recent studies indicate that between 2001 and 2020, the Amazon lost millions of hectares of rainforest, with consequences so severe that parts of the region are now a net carbon source. Roads and fires are major triggers: once a road is built, satellites show that deforestation quickly fans out in strips, as new land becomes accessible for cattle ranching and soy farming. The impact ripples far beyond trees—destroying the habitats of jaguars, macaws, and indigenous communities.
- Amazon deforestation leads the world in driving global biodiversity loss and greenhouse gas release.
- Landsat and MODIS images help governments enforce conservation laws, such as Brazil’s timber licensing system, using real-time spatial evidence.
- NASA-supported research in the Large-Scale Biosphere-Atmosphere Experiment in Amazonia (LBA) has refined both imagery techniques and ecological understanding of Amazon decline.
Southeast Asia: Palm Oil and the Borneo Crisis
Each year, new NASA flights and satellite passes capture the spread of monoculture palm plantations across the island of Borneo. The result: Borneo has lost over half its original forest cover since the 1970s. From above, satellites detect the telltale pale patterns of clear-cutting, in stark contrast to the lush, textured canopies that remain.
Much of this forest cover loss is due to the global demand for palm oil, a common ingredient found in foods, cosmetics, and biofuels. NASA’s imagery has shown the systematic drainage of peatlands for plantations, exacerbating regional carbon emissions and forest fires. Rainforests converted to plantations cannot sustain the region’s unique biodiversity, including endangered orangutans and pygmy elephants.
Central Africa: Congo Basin in the Crosshairs
The Congo Basin’s forests are the world’s second largest. NASA’s decadal analysis through the Pathfinder Project revealed dramatic losses driven by agriculture, logging, and the charcoal trade. These forests are crucial not only for local livelihoods, but also for regulating Africa’s rainfall and supporting endangered species such as gorillas and forest elephants.
Scientists are collaborating on new methods to update forest change maps, using satellite images from the 1990s through the 2000s and combining moderate- and high-resolution data for a more complete picture.
Deforestation in the United States: Old-Growth and Industrial Pressure
Though often overlooked, the United States has seen profound changes in forest cover. According to NASA and independent analyses, the U.S. lost approximately 104 million acres of forest between 2001 and 2020—a 15% decline in tree cover.
- Pacific Northwest (PNW): Once dominated by expansive old-growth forests, this region has lost roughly 13% of its old-growth cover in a little over a decade. Logging is a primary driver, but wildfires—also detected by satellite—are increasingly significant. Federal lands protect a portion of old growth, with the majority of losses occurring on non-federal lands.
- Southeastern United States: NASA images highlight a patchwork of agricultural clearings and managed pine plantations. More than 31% of forest cover in the Southeast has been lost or replaced, mostly to monoculture pine or agricultural land. Practices such as clear-cutting, swift replanting, and the draining of wetlands for plantation establishment have fundamentally altered the landscape.
- Alaska: Between 2001 and 2021, Alaska lost nearly 11% of its forest cover, primarily driven by wildfires and climate change-induced changes. NASA imagery and field studies demonstrate impacts on key wildlife, including caribou and brown bears, as previously remote forests become accessible for extraction and development.
How NASA Monitors Deforestation: Technology and Methods
NASA pioneered the use of remote-sensing technology for global forest surveillance. Key technological milestones include:
- Landsat satellites: Since the 1970s, providing high-resolution images for decades-long comparisons and detailed mapping of forest loss patterns.
- MODIS (Moderate Resolution Imaging Spectroradiometer): On the Terra and Aqua satellites, MODIS provides daily global images at 250-meter resolution, ideal for tracking big-picture change, fires, and burn scars.
- Hyperspectral and lidar sensors: New tools in development can distinguish tree species, measure canopy structure, and even probe multiple forest layers.
- Automated forest monitoring systems: By combining data from multiple sensors, agencies can develop timely “alarm” maps to spot rapid clearing, trigger policy response, and document illegal activity.
Applications range from targeted law enforcement to national-scale conservation. In Brazil, Landsat images are routinely used for timber licensing enforcement, while in Central Africa, NASA collaborates with local agencies for near real-time monitoring and policy coordination.
Causes and Consequences of Deforestation
The drivers of deforestation are diverse but share common threads across continents:
- Agricultural expansion: Clearing for crops (such as soybeans and palm oil) or cattle pastures is the single greatest cause of tropical forest loss.
- Logging: Both legal and illegal timber harvesting remove huge swaths of old-growth and secondary forest.
- Infrastructure development: New roads and settlements fragment forests, opening up remote areas to extraction and further clearing.
- Fire: Both intentional and uncontrolled wildfires, often set to clear land, are visible as scars and smoke plumes in satellite images.
- Climate change: Rising temperatures and droughts trigger more frequent, intense wildfires—amplifying tree loss.
The consequences of deforestation, as revealed by NASA’s monitoring programs, are grave:
- Biodiversity loss: Forest clearing destroys habitat, pushing species such as the orangutan, northern spotted owl, and others closer to extinction.
- Carbon emissions: Conversion of old-growth and peatland forests releases vast amounts of CO2, contributing to global warming.
- Water cycle disruption: Healthy forests regulate rainfall and river flow; widespread clearing destabilizes these patterns, fueling drought and flooding.
- Indigenous communities: Many native peoples rely on intact forests for their culture, food, and survival, facing displacement as forests disappear.
Solutions and the Future: How Monitoring Spurs Change
The vivid imagery from NASA and other earth observation agencies doesn’t merely document decline—it provides the building blocks for action. Concrete impacts of satellite monitoring include:
- Enforcement of conservation policy: Satellites offer unbiased, continuous records of land use, supporting the prosecution of illegal logging and aiding protected area management.
- Increased transparency: Real-time data empowers environmental groups, journalists, and indigenous advocacy—raising public pressure for change.
- Improved planning: High-resolution forest maps support sustainable forestry and smarter agricultural expansion, potentially reducing overall impact.
- Research collaboration: Multinational initiatives, such as the Large-Scale Biosphere-Atmosphere Experiment in Amazonia, rely on NASA data to fill scientific gaps and coordinate action.
The growing cost and technical hurdles of high-resolution global mapping are being met with better hardware, smarter data processing, and more robust international partnerships.
Frequently Asked Questions (FAQs)
Q: Why is NASA involved in tracking deforestation?
A: NASA’s satellites provide crucial, unbiased, long-term global data on forest change, enabling governments, scientists, and the public to measure, understand, and address deforestation’s causes and impacts.
Q: How does deforestation affect climate change?
A: Deforestation converts forests from carbon sinks to carbon sources, accelerating atmospheric CO2 buildup and global warming. Recent data shows areas such as the Amazon can emit more CO2 than they absorb due to extensive clearing and burning.
Q: Can satellite images stop deforestation?
A: While satellites alone can’t halt tree loss, their real-time data empowers timely law enforcement, guides reforestation efforts, and increases accountability, forming the backbone of global conservation strategies.
Q: How much forest has the US lost recently?
A: Between 2001 and 2020, the United States lost about 104 million acres of forest—about 15% of total tree cover—due to logging, development, wildfire, and plantation conversion.
Q: Which regions are losing forests the fastest?
A: The most rapid deforestation is occurring in the Amazon, Borneo, Southeastern US, and the Congo Basin—mostly in tropical regions, but also in areas like Alaska where climate change and fire are increasing losses.
References
- https://www.green.earth/blog/deforestation-in-the-united-states-causes-consequences-and-cures
- https://earthobservatory.nasa.gov/features/Deforestation/deforestation_update4.php
- https://earth.org/deforestation-facts/
- https://mynasadata.larc.nasa.gov/basic-page/deforestation
- https://gfr.wri.org/latest-analysis-deforestation-trends
Read full bio of medha deb


